
Key Developments
Our top market developments of the past month are as follows:
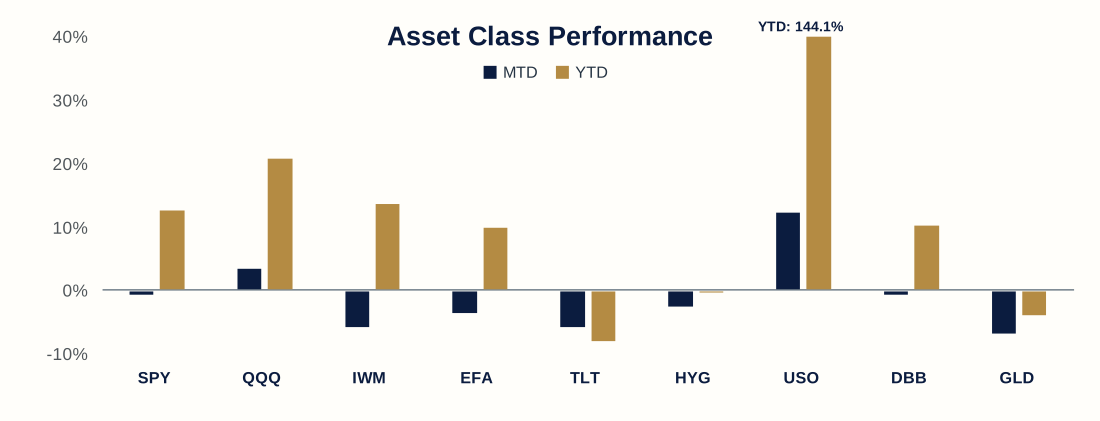
1) The Bill Arrives – The AI story shifted from a demand debate to financing concerns: CoreWeave bond yield stress and Meta’s “hundreds of billions” in flagged capital needs drove an eight-session SOX index losing streak (semis -15.4%, memory -20.5%). Demand was not the issue. Microsoft Azure grew 48%, Google Cloud 103%, and AWS 39%. The question is seemingly not whether to build, but how to pay for it.
2) Below Five – Treasuries rallied as AI and growth concerns overtook inflation and fiscal worries: 10-year yields fell 35bp from fresh 24-year highs, dipping below 5% before oil firmed late in the month. Strong auctions and easing fiscal concerns helped – even as France’s 10-year briefly topped 5% for the first time since 2002.
Source: Bloomberg Finance L.P. (“Bloomberg”)*.
3) Strait Up! – Middle East crude exports are back at or near prewar levels – answering last month’s durability question. Yet WTI rose 15.2% to above $100 (a fourth straight monthly gain) on increased attacks on Hormuz shipping and reports of short, intensive US strikes being prepared post-election. The current price reflects a war premium, not scarcity.
* Through Oct. 31, 2026; SPY (SPDR S&P 500 ETF Trust); QQQ (Invesco QQQ Trust Series 1); IWM (iShares Russell 2000 ETF); EFA (iShares MSCI EAFE ETF); TLT (iShares 20+ Year Treasury Bond ETF); HYG (iShares iBoxx High Yield Corporate Bond ETF); USO (United States Oil Fund LP); DBB (Invesco DB Base Metals Fund); and GLD (SPDR Gold Shares).
Market data (index returns, Treasury and sovereign yields, and NYMEX WTI crude futures prices) per Bloomberg as of Oct. 31, 2026; crude export volumes per Goldman Sachs Research, October 2026. The source(s) used to prepare this material is/are believed to be true, accurate, and reliable, but is/are not guaranteed. Past performance is no guarantee of future results. Performance results reflect historical total return and do not guarantee future performance. Benchmark indexes are unmanaged and do not reflect transaction costs, custodial fees, or advisory fees. You cannot invest directly in an index.
Portfolio Considerations
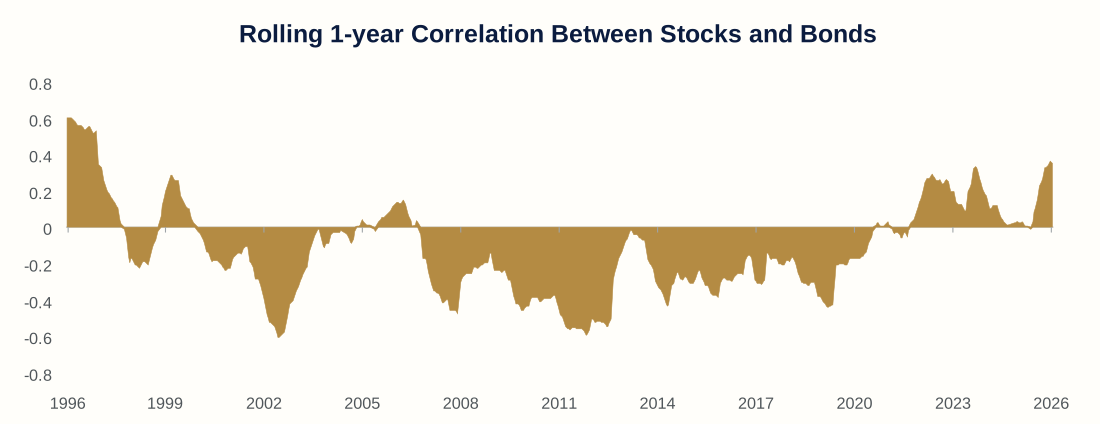
➢ Back to the Future – On several days during October’s tech volatility, Treasuries rallied as the AI complex sold off, the kind of offset diversified portfolios rely on. Commentators have been falling over themselves to declare balanced portfolios dead, but this view overemphasizes recent history. While there is no guarantee that past patterns will re-emerge, the chart shows that stock-bond correlations were generally negative in the two decades before Covid.
➢ Tug of War – Fears of slowing AI spend can boost bonds in two ways. Beyond the familiar channel of recession- and market-risk hedging, less issuance to fund the AI buildout should ease the battle for capital that has likely played a role in rate rises.
Source: Bloomberg. Correlations given are between the S&P 500 Index (“Stocks”) and the Bloomberg US Aggregate Index (“Bonds”). The source(s) used to prepare this material is/are believed to be true, accurate, and reliable, but is/are not guaranteed.
Looking forward…
➢ Midterm Exams? – The vote may matter less than what follows it. A short, intensive campaign against Iran would put oil’s war premium to the test, and oil has lately driven everything – inflation, yields, and December hike odds. A quieter, post-election Middle East could unwind all three, while escalation likely entrenches them.
Disclosure
Investors should consider the investment objectives, horizons, income tax brackets, risks, charges and expenses of any variable product carefully before investing. This and other information about the investment company is contained in each fund’s offering memorandum, which can be obtained by emailing info@gideonsp.com. Please read it carefully before you invest.
By accepting these materials, the recipient agrees to keep the materials and their content confidential and not to use them or the content for any purpose other than to evaluate a financial transaction with Gideon Strategic Partners, LLC of the type described in the materials, except that there is no limitation on the disclosure of the tax treatment or tax structure of the products and transaction structures contained herein. Any unauthorized use or disclosure of these materials without Gideon Strategic Partners, LLC’s written consent is prohibited. The views expressed herein reflect the opinion of the author as of November 1, 2026, and may change as market conditions vary. These views are for informational purposes only, do not constitute investment advice or a recommendation to buy or sell any security, and economic forecasts may not develop as predicted. This information is provided as general market commentary and is not intended to be specific financial or investment guidance. Investing involves risk, including possible loss of principal. Bonds remain subject to interest rate and market risk, and diversification cannot assure a profit or protect against loss.
Securities and Investment Advisory Services offered through Simplicity Investments. Securities Dealer, Member FINRA/SIPC; TLG Advisors, Inc. Registered Investment Advisor; 475 Springfield Ave., Summit, NJ 07901 (303) 797-9080. Gideon Strategic Partners is not affiliated with Simplicity Investments.